
Infographic: Age and Fraud
Which age group files the most fraud reports? The data may surprise you.
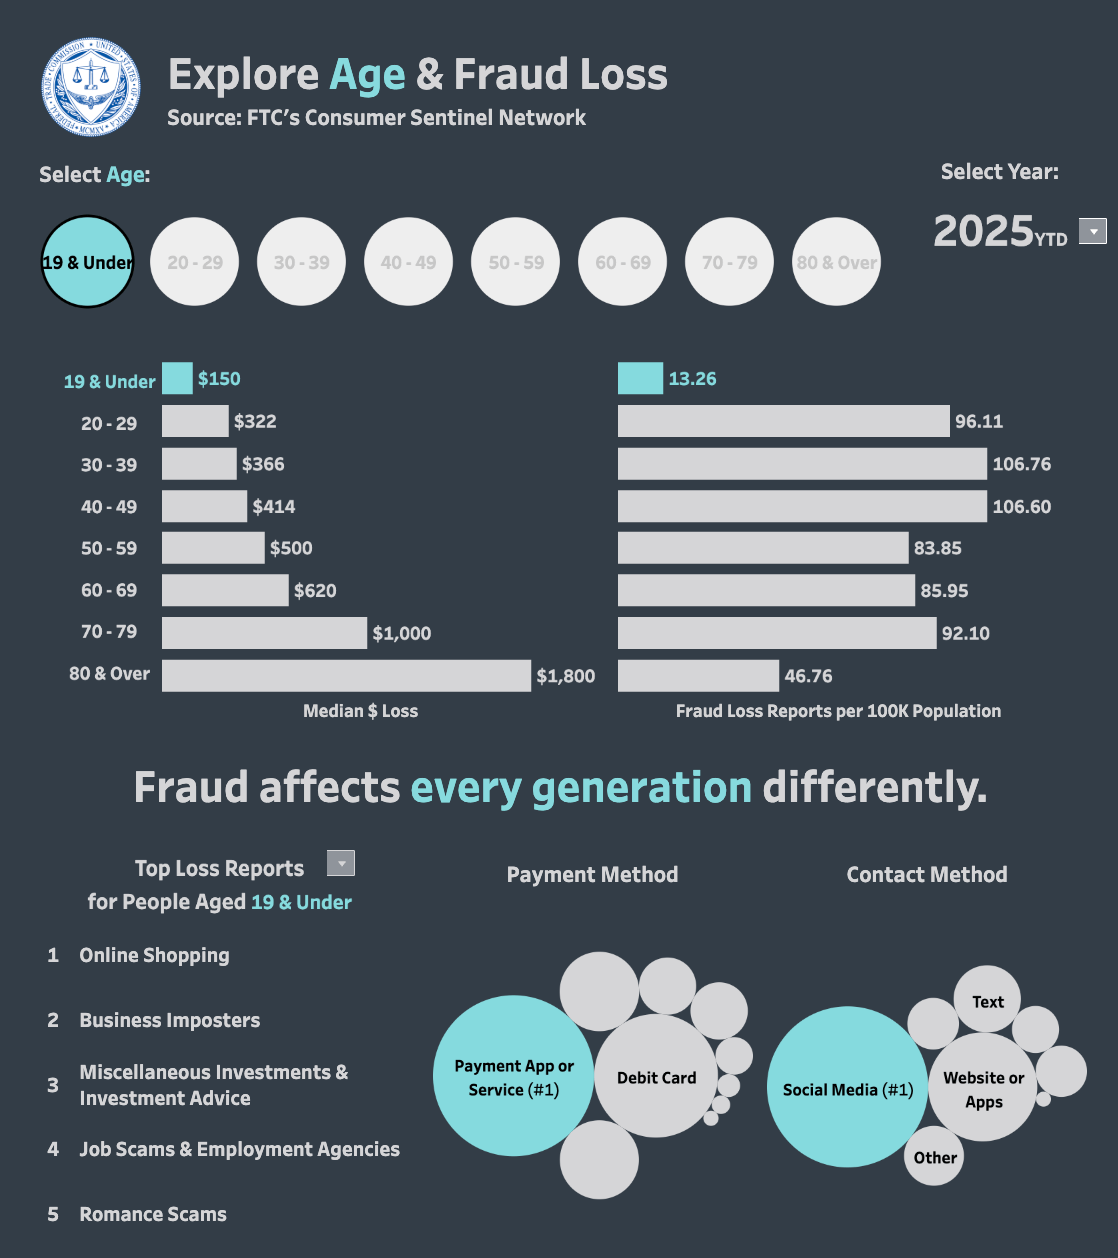
The FTC’s interactive infographic explores the relationship between age and fraud. Click through the various age groups to see how many fraud reports are filed, how much money is lost, and more!
Questions:
- How does the Median $ Lost compare to the number of Fraud Loss Reports for different age groups? What general trend(s) do you observe?
- What is the most common contact method for each age group? Does this surprise you? Why or why not?
- How might social media and technology contribute to fraud risks for all age groups?
- What strategies could young people use to spot and avoid fraud and scams online?
- How might fraud prevention messages need to change for different age groups?
About the Author
Sonia Dalal
Sonia has always been passionate about instruction and improving students' learning experiences. She's come a long way since her days as a first grader, when she would "teach" music and read to her very attentive stuffed animals after school. Since then, she has taught students as a K-12 tutor, worked in several EdTech startups in the Bay Area, and completed her Ed.M in Education from the Harvard Graduate School of Education. She is passionate about bringing the high quality personal finance content and instruction she wished she'd received in school to the next generation of students and educators. When she isn't crafting lesson guides or working with teachers, Sonia loves to spend her time singing, being outdoors, and adventuring with family and friends!
SEARCH FOR CONTENT
Subscribe to the blog
Join the more than 11,000 teachers who get the NGPF daily blog delivered to their inbox:
MOST POPULAR POSTS


